This plots the output of fcmconfr() using ggplot. Set shiny = TRUE to load plot in a Shiny app and toggle on/off results from different analyses.
Usage
# S3 method for class 'fcmconfr'
plot(
  x,
  include = "all",
  shiny = FALSE,
  filter_limit = 0.001,
  xlim = NA,
  coord_flip = FALSE,
  text_font_size = NA,
  mc_avg_and_CIs_color = "blue",
  mc_inferences_color = "blue",
  mc_inferences_size = 1,
  mc_inferences_alpha = 0.3,
  mc_inferences_shape = 3,
  ind_inferences_color = "black",
  ind_inferences_size = 1,
  ind_inferences_alpha = 1,
  ind_inferences_shape = 16,
  agg_inferences_color = "red",
  agg_inferences_size = 1,
  agg_inferences_alpha = 1,
  agg_inferences_shape = 17,
  mc_avg_and_CIs_linewidth = 0.1,
  ind_ivfn_and_tfn_linewidth = 0.1,
  agg_ivfn_and_tfn_linewidth = 0.6,
  ...
)
Arguments
- x
A direct output of the
fcmconfrfunction- include
[
character()]
The concepts to include in the plot. By default, include = 'all' which does not exclude any concepts. Set to a vector of concept names to identify the only concepts to include in the plot.- shiny
[
logical(1)]
If TRUE, launch plot in a Shiny app to toggle on/off results from different analyses.- filter_limit
[
double(1)]
Only nodes with inferences above the filter_limit across any analysis will be plotted. This removes nodes with mostly 0-valued inferences indicating they were not impacted in the simulation.- xlim
[
double(1)]
The x-axis plot limits. xlim = NA lets ggplot determine the x-axis limits. xlim = c(lower_limit, upper_limit) for manual input limits. See ?ggplot2::xlim for additional info.- coord_flip
[
logical(1)]
Swap x- and y-axes (i.e. rotate plot). See ?ggplot2::coord_flip for additional info.- text_font_size
[
double(1)]
The font size of axis labels. text_font_size = NA lets ggplot determine the axis label font size.- mc_avg_and_CIs_color
[
character(1)]
Color of the crossbar (lines) indicating the avg inferences of empirical FCMs generated via Monte Carlo sampling and the confidence intervals about those averages.- mc_inferences_color
[
character(1)]
Color of the points representing inferences of empirical FCMs generated via Monte Carlo sampling.- mc_inferences_size
[
double(1)- Positive]
Size of the points for inferences of Monte Carlo FCMs. Must be greater than 0.- mc_inferences_alpha
[
double(1)- Positive (between 0 and 1)]
Transparency of the points representing inferences of empirical FCMs generated via Monte Carlo sampling. Range from 0 to 1 (0: Transparent to 1: Opaque).- mc_inferences_shape
[
integer(1)orcharacter(1)]
Point shapes of the points representing inferences of empirical FCMs generated via Monte Carlo sampling. Accepts PCH point values and character strings.- ind_inferences_color
[
character(1)]
Color of the points representing inferences of individual FCMs.- ind_inferences_size
[
double(1)- Positive]
Size of the points for inferences of individual FCMs. Must be greater than 0.- ind_inferences_alpha
[
double(1)- Positive (between 0 and 1)]
Transparency of the points representing inferences of individual FCMs. Range from 0 to 1 (0: Transparent to 1: Opaque).- ind_inferences_shape
[
integer(1)orcharacter(1)]
Point shapes of the points representing inferences of individual FCMs. Accepts PCH point values and character strings. Ignored for IVFN FCMs.- agg_inferences_color
[
character(1)]
Color of the points representing inferences of the aggregate FCM- agg_inferences_size
[
double(1)- Positive]
Size of the points for inferences of aggregate FCM. Must be greater than 0.- agg_inferences_alpha
[
double(1)- Positive (between 0 and 1)]
Transparency of the points representing inferences of the aggregate FCM. Range from 0 to 1 (0: Transparent to 1: Opaque).- agg_inferences_shape
[
integer(1)orcharacter(1)]
Point shapes of the points representing inferences of the aggregate FCM. Accepts PCH point values and character strings. Ignored for IVFN FCMs.- mc_avg_and_CIs_linewidth
[
double(1)- Positive]
Linewidth of lines representing the average (and confidence bounds the average) of the Monte Carlo FCMs inferences- ind_ivfn_and_tfn_linewidth
[
double(1)- Positive]
Linewidth of lines representing inferences for analyses of individual IVFN- and TFN- FCMs.- agg_ivfn_and_tfn_linewidth
[
double(1)- Positive]
Linewidth of lines representing inferences for analyses of aggregate IVFN- and TFN- FCMs- ...
Additional inputs
Details
Generates a generic plot visualizing fcmconfr results.
Examples
# Example using TFN FCMs fcmconfr
tfn_example_fcmconfr <- fcmconfr(
adj_matrices = sample_fcms$simple_fcms$tfn_fcms,
# adj_matrices = group_tfn_fcms,
# Aggregation and Monte Carlo Sampling
agg_function = 'mean',
num_mc_fcms = 100,
# Simulation
initial_state_vector = c(1, 1, 1, 1, 1, 1, 1),
clamping_vector = c(1, 0, 0, 0, 0, 0, 0),
activation = 'rescale',
squashing = 'sigmoid',
lambda = 1,
point_of_inference = "final",
max_iter = 1000,
min_error = 1e-05,
# Inference Estimation (bootstrap)
ci_centering_function = "mean",
confidence_interval = 0.95,
# Runtime Options
show_progress = TRUE,
parallel = FALSE,
# Additional Options
run_agg_calcs = TRUE,
run_mc_calcs = TRUE,
run_ci_calcs = TRUE,
include_zeroes_in_sampling = TRUE,
include_sims_in_output = TRUE
)
#> [1] Simulating Input FCMs
#>
#> [1] Running Simulations
#> [1] Sampling from column vectors
#> Sampling from column vectors[1] Constructing monte carlo fcms from samples
#> Constructing monte carlo fcms from samples
#> [1] Running Simulations
#> [1] Performing bootstrap simulations
#> [1] Done
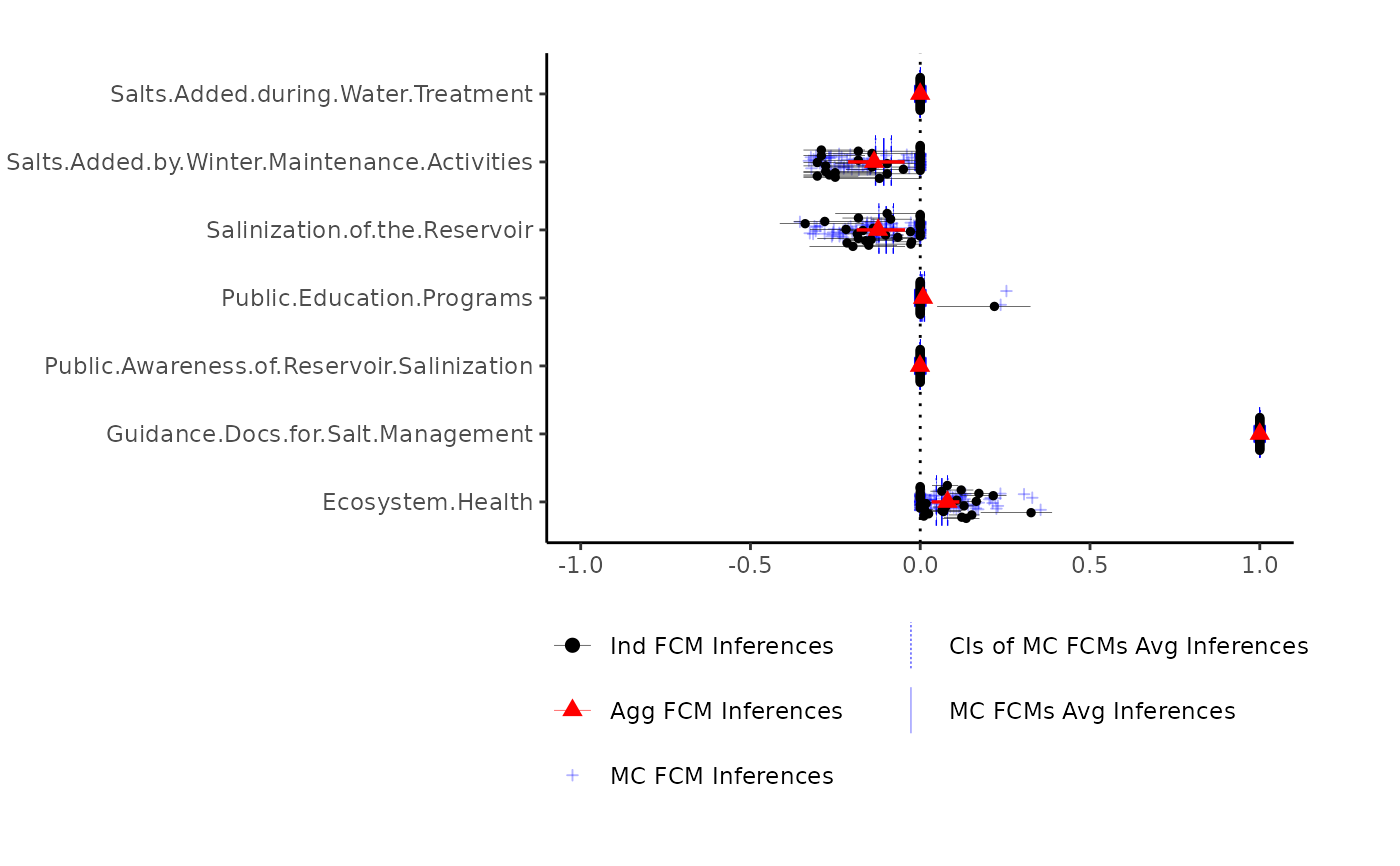
# Plot Defaults
plot(tfn_example_fcmconfr,
interactive = FALSE, # Set to TRUE to open shiny app
# Plot Formatting Parameters
filter_limit = 1e-4,
xlim = c(-1, 1),
coord_flip = FALSE,
text_font_size = NA,
# Plot Aesthetic Parameters
mc_avg_and_CIs_color = "blue",
mc_inferences_color = "blue",
mc_inferences_alpha = 0.3,
mc_inferences_shape = 3,
ind_inferences_color = "black",
ind_inferences_alpha = 1,
ind_inferences_shape = 16,
agg_inferences_color = "red",
agg_inferences_alpha = 1,
agg_inferences_shape = 17,
ind_ivfn_and_tfn_linewidth = 0.1,
agg_ivfn_and_tfn_linewidth = 0.6
)
#> Warning: ! Warning: Additional Inputs given as ... are ignored
#> ~~~~~ Ignoring additional inputs: interactive
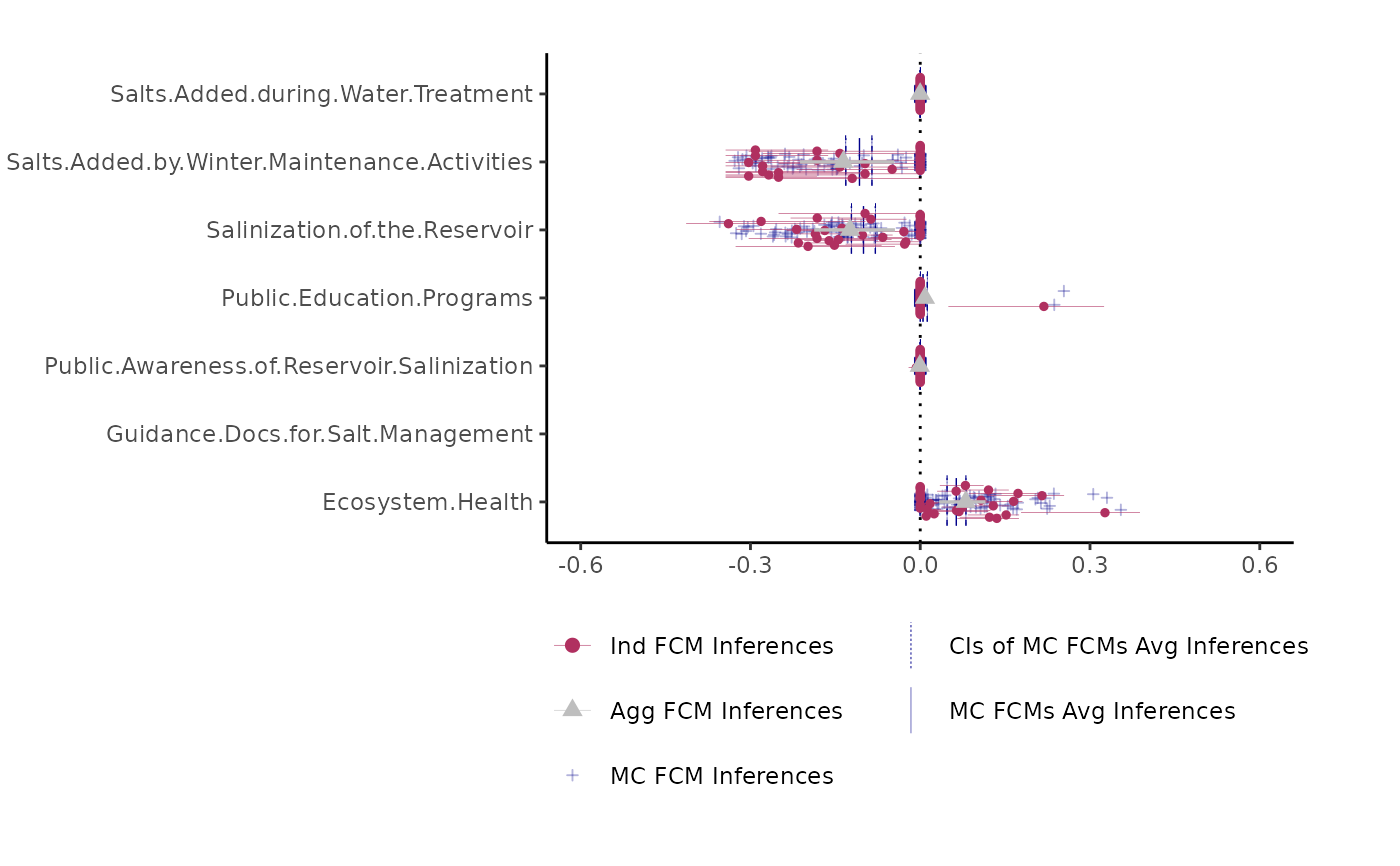
 # Different from Plot Defaults
plot(tfn_example_fcmconfr,
interactive = FALSE, # Set to TRUE to open shiny app
# Plot Formatting Parameters
filter_limit = 1e-4,
xlim = c(-0.6, 0.6),
coord_flip = FALSE,
# Plot Aesthetic Parameters
mc_avg_and_CIs_color = "darkblue",
mc_inferences_color = "darkblue",
mc_inferences_shape = 3,
ind_inferences_color = "maroon",
ind_inferences_shape = 16,
agg_inferences_color = "grey",
agg_inferences_shape = 17,
ind_ivfn_and_tfn_linewidth = 0.1,
agg_ivfn_and_tfn_linewidth = 0.6
)
#> Warning: ! Warning: Additional Inputs given as ... are ignored
#> ~~~~~ Ignoring additional inputs: interactive
# Different from Plot Defaults
plot(tfn_example_fcmconfr,
interactive = FALSE, # Set to TRUE to open shiny app
# Plot Formatting Parameters
filter_limit = 1e-4,
xlim = c(-0.6, 0.6),
coord_flip = FALSE,
# Plot Aesthetic Parameters
mc_avg_and_CIs_color = "darkblue",
mc_inferences_color = "darkblue",
mc_inferences_shape = 3,
ind_inferences_color = "maroon",
ind_inferences_shape = 16,
agg_inferences_color = "grey",
agg_inferences_shape = 17,
ind_ivfn_and_tfn_linewidth = 0.1,
agg_ivfn_and_tfn_linewidth = 0.6
)
#> Warning: ! Warning: Additional Inputs given as ... are ignored
#> ~~~~~ Ignoring additional inputs: interactive
 # Plot Defaults w/ Shiny App
# plot(tfn_example_fcmconfr,
# shiny = TRUE, # Set to TRUE to open shiny app
# # Plot Formatting Parameters
# filter_limit = 1e-4,
# coord_flip = FALSE,
# text_font_size = 12,
# # Plot Aesthetic Parameters
# mc_avg_and_CIs_color = "blue",
# mc_inferences_color = "blue",
# mc_inferences_shape = 3,
# ind_inferences_color = "black",
# ind_inferences_shape = 16,
# agg_inferences_color = "red",
# agg_inferences_shape = 17,
# ind_ivfn_and_tfn_linewidth = 0.1,
# agg_ivfn_and_tfn_linewidth = 0.6
# )
# Plot Defaults w/ Shiny App
# plot(tfn_example_fcmconfr,
# shiny = TRUE, # Set to TRUE to open shiny app
# # Plot Formatting Parameters
# filter_limit = 1e-4,
# coord_flip = FALSE,
# text_font_size = 12,
# # Plot Aesthetic Parameters
# mc_avg_and_CIs_color = "blue",
# mc_inferences_color = "blue",
# mc_inferences_shape = 3,
# ind_inferences_color = "black",
# ind_inferences_shape = 16,
# agg_inferences_color = "red",
# agg_inferences_shape = 17,
# ind_ivfn_and_tfn_linewidth = 0.1,
# agg_ivfn_and_tfn_linewidth = 0.6
# )